
Digging Deeper into Data
Now that you have an overview of how good data can lead to good decisions, we will next explore more targeted applications of data analysis with a case study of how evolveEA uses this information to support informed decisionmaking in the communities we serve.
What is a Primary Cross-Sectional Survey and what are their benefits?
‘Primary’ data collection is data collected by the end-user, and ‘cross-sectional’ data is data collected at a single point in time. When conducting primary data collection, the investigating party can target specific groups most related to their topic of study, and ask questions directly related to their subject of interest. Primary targeted surveys might be collected by anyone trying to understand how multiple variables are distributed across a population and the relationship between those variables.
One beneficial character of a primary dataset is that it covers information specifically related to a study topic as opposed to correlated information acting as an indicator for your study topic when using secondary (‘collected by third party) data. A second beneficial characteristic is that primary data can be collected in a disaggregated format compared to a aggregated format common to public demographic surveys. Disaggregated datasets allow investigators to drill down into multiple topics in ways that allow data users to cross-tabulate those topics for a nuanced understanding of their subject of focus.
Primary cross-sectional surveys are particularly useful for non-profits, community-oriented services, municipal bodies like Borough Managers or County Departments that have a diverse constituency, or specific service charges that require bespoke delivery. An example of a local primary survey is the Disaggregated Data on Pittsburgh Lead Service Lines which is a more powerful dataset for making decisions on capital improvements to infrastructure for lead exposure, compared to the Aggregated Data on Allegheny County Elevated Blood Lead Level, which indicates broad distribution of the issue but would be challenging to use for designing capital projects.
How does a Primary Survey diverge from common demographic data like the census and ACS
The biggest distinction between a local primary dataset and more generalist datasets like the American Community Survey is it being aggregated versus disaggregated data. Frequently public datasets take individual survey responses and group them by answer and region. This is called aggregation, and gives us common census geographies like the census tract, or census block group. This helps protect privacy of respondents, and allows us to compare one geography to another. This also prevents those analyzing the data from ‘cross tabulating’ questions. For example, with this data we cannot isolate low-income households who make less than $25,000 annually, who have a large family size, don’t have access to a vehicle, and are a minority race. While the American Community Survey provides some cross-tabulated data, like Income x Age x Race x Gender, these queries are not possible by data users, except by direct requests to the Census Bureau.
The second distinction is that a primary survey addresses the specific topic of interest opposed to indicators of that topic. Some subjects are poorly tracked by local governments or broad surveys like the ACS. Subjects like food accessibility, or where local residents prefer to buy groceries, often needs to be deduced by a related indicator like nearby grocery stores, from a general business dataset like Safe Graph and a local transit operator’s network like Port Authority. However, a primary targeted survey focused on improving food access can directly ask the population they serve: “Where do you shop for food and how do you get there?” This kind of targeted survey can better serve local organizations that need to prioritize direct action, compared to broader policy and budgetary decisions that the Census Bureau and Bureau of Labor Statistics are focused on supporting.
Example: The Millvale Community Needs Assessment
A local example of a primary cross-sectional survey is the Millvale Community Needs Assessment (CNA). This survey was performed by the Millvale Community Library in 2017 to better understand the residents of Millvale, so that the Library, Borough, and their partners can better serve them. After extensive outreach, the Library achieved a sample population of approximately 22%, which is high compared to the census’ sample size of approximately 16.5% of households or the American Community Survey that samples approximately 2% of households every year (Source). The survey asked questions related to housing, employment, household needs, safety, children and young adults, and generally, living in Millvale.
Once the COVID-19 crisis began to affect communities locally, Brian Wolovich (Triboro Ecodistrict Director and the individual who oversaw the survey) called upon the survey results for guidance. Using cross-tabulation of the survey results, evolveEA helped determine which Millvale residents are most likely to be impacted by the COVID-19 crisis and in what ways.
For example, according to the survey, seniors compose nearly one-third of Millvale’s population, and are 1.4 times more likely to lack access to the internet compared to the average Millvale resident. These seniors are unable to order food or essential goods online, meaning that even though they are more vulnerable to the virus, they must physically visit a store to meet their needs.

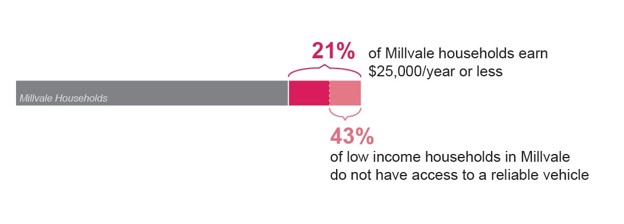
According to the survey, 21% of households are considered low-income (household income is less than $25,000 per year). Low-income households in Millvale are 2.5 times more likely to lack access to a reliable vehicle, making it difficult to access groceries and essential services in times of emergency. Additionally, low-income households are twice as likely to lack access to the internet and twice as likely to have difficulty paying for basic needs. As unemployment skyrockets across the nation, these households will have an increasingly difficult time meeting essential needs.
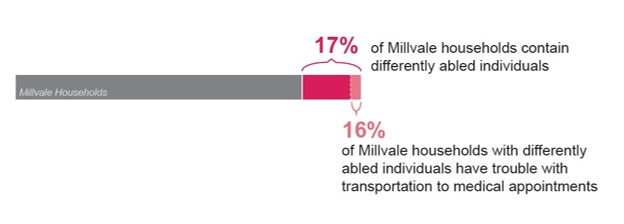
Lastly, the survey identified that 17% of households in Millvale contain differently-abled individuals. These individuals are 3.4 times more likely to have trouble with transportation to medical appointments than the average Millvale resident. If these individuals were to become ill during the COVID-19 crisis, it is less likely they would be able to access the medical care that they need.
Capturing Primary Disaggregated Survey Data in the Future
Whether your community is experiencing a crisis or not, Primary Disaggregated surveys can provide immense value to inform decision making and investments. For example, the Triboro Ecodistrict is performing an energy baseline survey to better understand how residents use energy. The results of the survey will help prioritize programs and projects that will provide the biggest impact in reducing energy consumption. Similarly, the Allegheny County Economic Development Department is issuing a survey to better understand how local businesses are being impacted by COVID-19, which will inform business support programs. (Check our the ‘currently open business map’ that is one datapoint within the business survey. If you are an Allegheny county business, please add your details!)
As a last note, while primary surveys provide immense value, it is still incredibly important to participate in and reference large-scale data collection efforts such as the census. The more responses they receive, the more accurate the results will be. This is especially important because the census results will determine State and federal resource allocations for the next ten years.
Contributing Authors: Nico Azel