Mapping the City of Buffalo’s Urban Forest
As urban designers today, we find ourselves surrounded by an ever-expanding set of tools for understanding communities and spaces in which we work. When it comes to the spatial mapping and recording of physical objects, Lidar is one accurate, high-resolution tool at our disposal. Lidar is a technique using light radar as to locate and map points in 3D. Lidar is not a new tool, but it’s application in urban design has been quickly expanding. In conjunction with Lidar, the use of Photogrammetry has also emerged as an accessible means of generating high-resolution models for recoding and analyzing our environment.
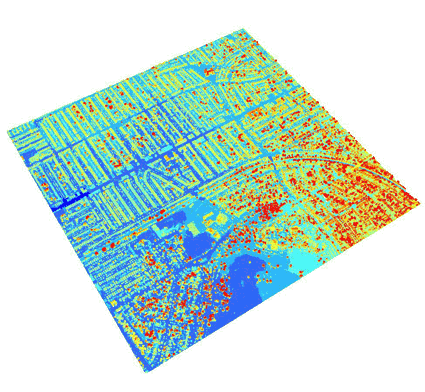
A Lidar generated elevation map of Buffalo is helping us understand the flow of rainwater through the city
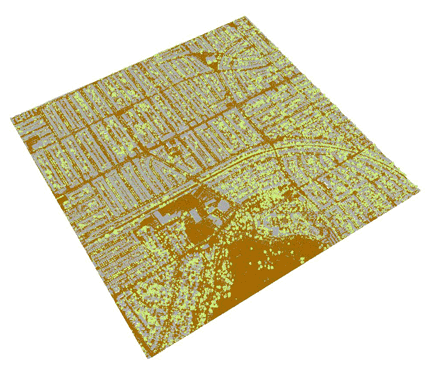
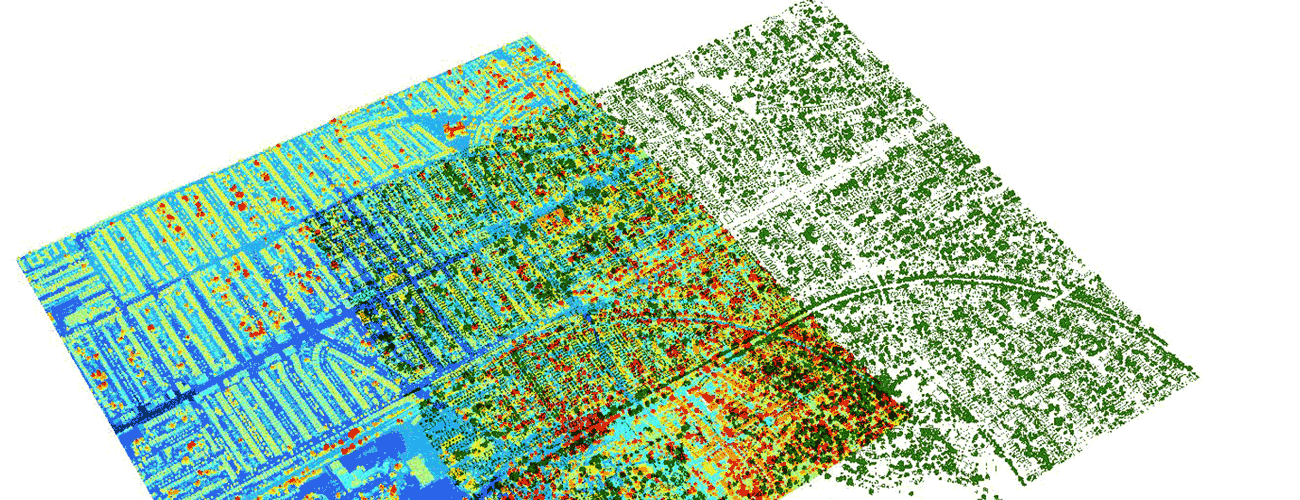
A Lidar generated image showing vegetated areas of Buffalo in green
Here at evolveEA we use Lidar for urban mapping and 3D modeling, typically for simple tasks like extracting contours for a project area, or determining building heights for more accurate models. But recently we had an opportunity to use Lidar at a larger scale for a deeper analysis in the City of Buffalo, NY as part of Raincheck 2.0. Raincheck 2.0 is a citywide strategic plan for the Buffalo Sewer Authority (BSA) to deliver green infrastructure projects and reduce stormwater runoff contributing to its combined sewer system.
As part of this effort, a Tree Inventory is being conducted by Arcadis, Core Studio, and evolveEA, and we have been tasked with estimating the location of all tree canopy cover across the city. Trees help absorb and slow stormwater, which reduces the pollution of waterways. We used ArcGIS and developed a custom model builder tool to process the Lidar data and generate vector files showing Buffalo’s canopy cover. The tool allowed for automated sorting of approximately 500 million points and converted that into data that will help Buffalo expand its urban forest in areas currently least shaded. So far we have processed over 8 gigabytes of data. Now we are interpreting the resulting canopy cover layer into actionable recommendations and summary statistics for BSA long term planning.
We are still working on Raincheck 2.0, but there are already some interesting takeaways from our Buffalo Lidar experience. It’s amazing how rich in information Lidar can be—the datasets we used date back to 2014, and other cities also have lidar datasets that have not yet been analyzed. This reveals an opportunity to leverage all of this data toward impactful urban planning. Better understanding canopy cover across Buffalo enables us to strategically address stormwater issues, as well as environmental justice. Our analysis will help identify areas of the city where planting more trees can improve people’s quality of life, and spread ecological assets more consistently throughout Buffalo’s landscape.