Visualizing Air Quality
“I don’t smell anything.”
“Trust me, it’s better than it used to be.”
These are the two most common retorts from Pittsburghers when I remark on the heavy odors associated with the city’s air quality. Both statements are true (I take their word on the first one), so both deserve a thoughtful response.
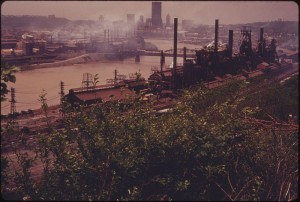
A smokey and smog covered Pittsburgh in the 1970s
It’s true that Pittsburgh no longer needs street lamps at noon to help commuters navigate city streets shrouded in black smog. The city has made strides in creating livable spaces where there was once industry, and it should be—and has been—recognized for those efforts. But as initiatives and advocacy groups, such as the Heinz Endowment’s Breathe Project and GASP (Group Against Smog and Pollution), have successfully communicated in recent years, being “better” is not good enough. This summer the American Lung Association once again listed Pittsburgh in the top ten Most Polluted Cities in the U.S., sparking a debate in the pages of the Post-Gazette (here, here, and here) on whether Pittsburgh’s air quality is terrible or really terrible. I’ll put that discussion aside and turn my focus to the more personal issue of how to understand air pollution even when it goes undetected in your day-to-day life.
Olfactory fatigue is the brain’s tendency to stop registering distinct smells that it’s been exposed to over a prolonged period. It’s why we notice the intensity of smell when first entering a bakery/pet store/pool but are largely unaware of it by the time we leave. Many of Pittsburgh’s longtime residents seem to have developed a kind of permanent olfactory fatigue to the industrial smells that settle in residential areas of the city in the early mornings. For those of us who didn’t grow up in Pittsburgh, or those of us with particularly sensitive noses, commenting on the pervasive smell of pollution outside and being met with blank stares has a mildly insanity-inducing effect. We may as well be saying, “I see dead people.” Fortunately for air quality advocates, pollution can be measured and visualized.
Here are three ways you can see air pollution, even if you can’t smell it:
1) The Breathe Project’s Pollutant Maps. The Breathe Project’s pollutant maps, developed by the Carnegie Mellon Center for Atmospheric Particle Studies (CAPS) allows you to see average annual concentrations of both black carbon and Nitrogen Dioxide in Allegheny County. They bring to light in colorful detail the elevated concentrations of black carbon that settle in the city’s many valleys. Through collaboration with CMU CREATE Lab, the Breathe Project maps now offer the ability to enter your address to see the pollutant concentrations in your neighborhood.
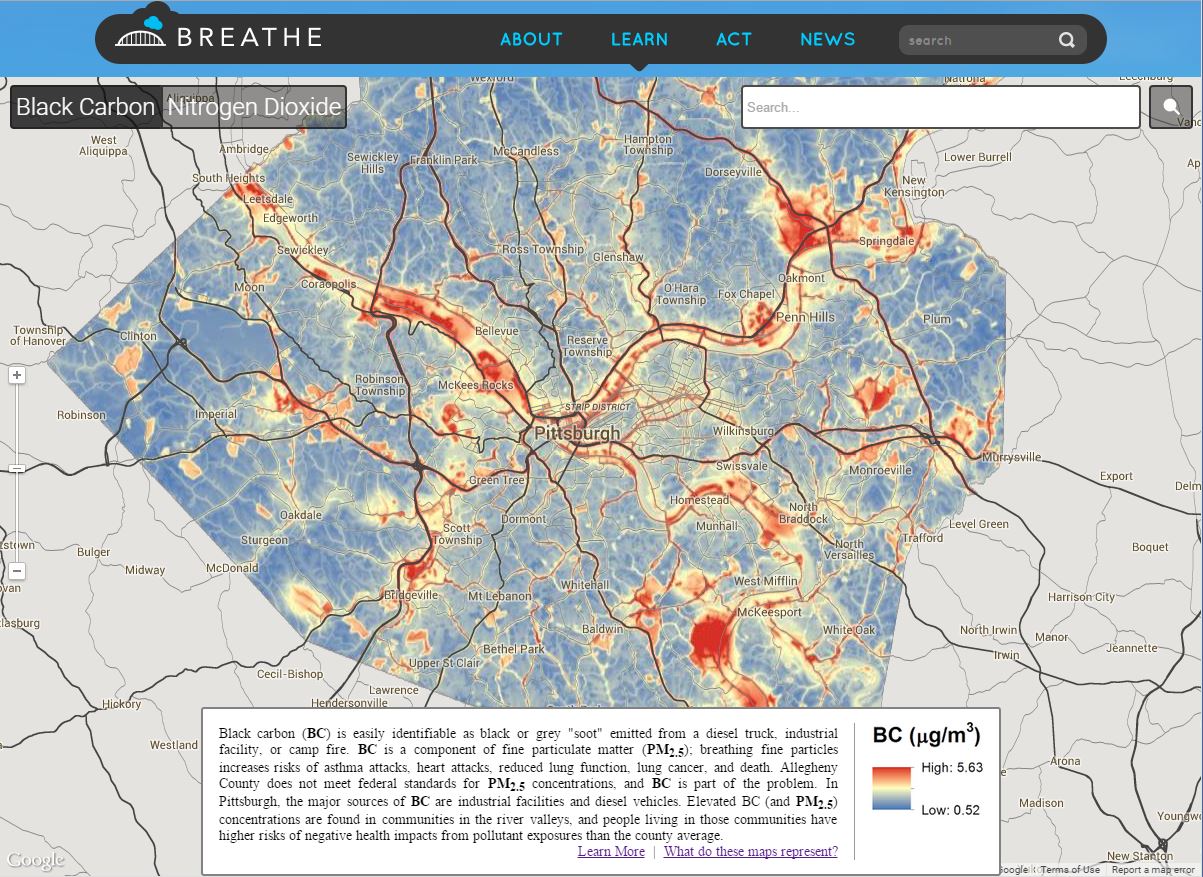
click to enlarge
2) AirNow Air Quality Index (AQI) Maps. The morning of writing this, I woke to the now-familiar smell of industrial pollution filling my East Liberty rowhouse and carried out what has become a morning ritual: I closed all of the windows, turned on the house fan to push air through the furnace filter, turned up the setting on the air purifier in my infant daughter’s room, and then checked AirNow.gov to see if the source of the smell was where I expected it to be. Here are the screenshots of the AQI readings from this morning. They show color-coded concentrations of PM2.5 (fine particles smaller than 2.5 micrometers that can have adverse health effects). See if you can guess where three major steel and coke works are located on the maps (Hint: It’s at the epicenter of the ominous, claw-shaped cloud of pollution clamping down on Pittsburgh).
3) Consumer Air Quality Monitors. Air quality monitors detect and count fine particulate matter (invisible pollutants) in indoor spaces. This spring I used three Dylos air quality monitors to measure PM2.5 over a 48-hour period in my home and then graphed the results. On both days, I observed the same sulphuric smells associated with the Mon Valley industrial plants. Though more anecdotal than scientific, the graph correlates with the observed smells and shows that the fine particle count increased outdoors before subsequently increasing indoors, meaning that unhealthy air in the home was originating outside.
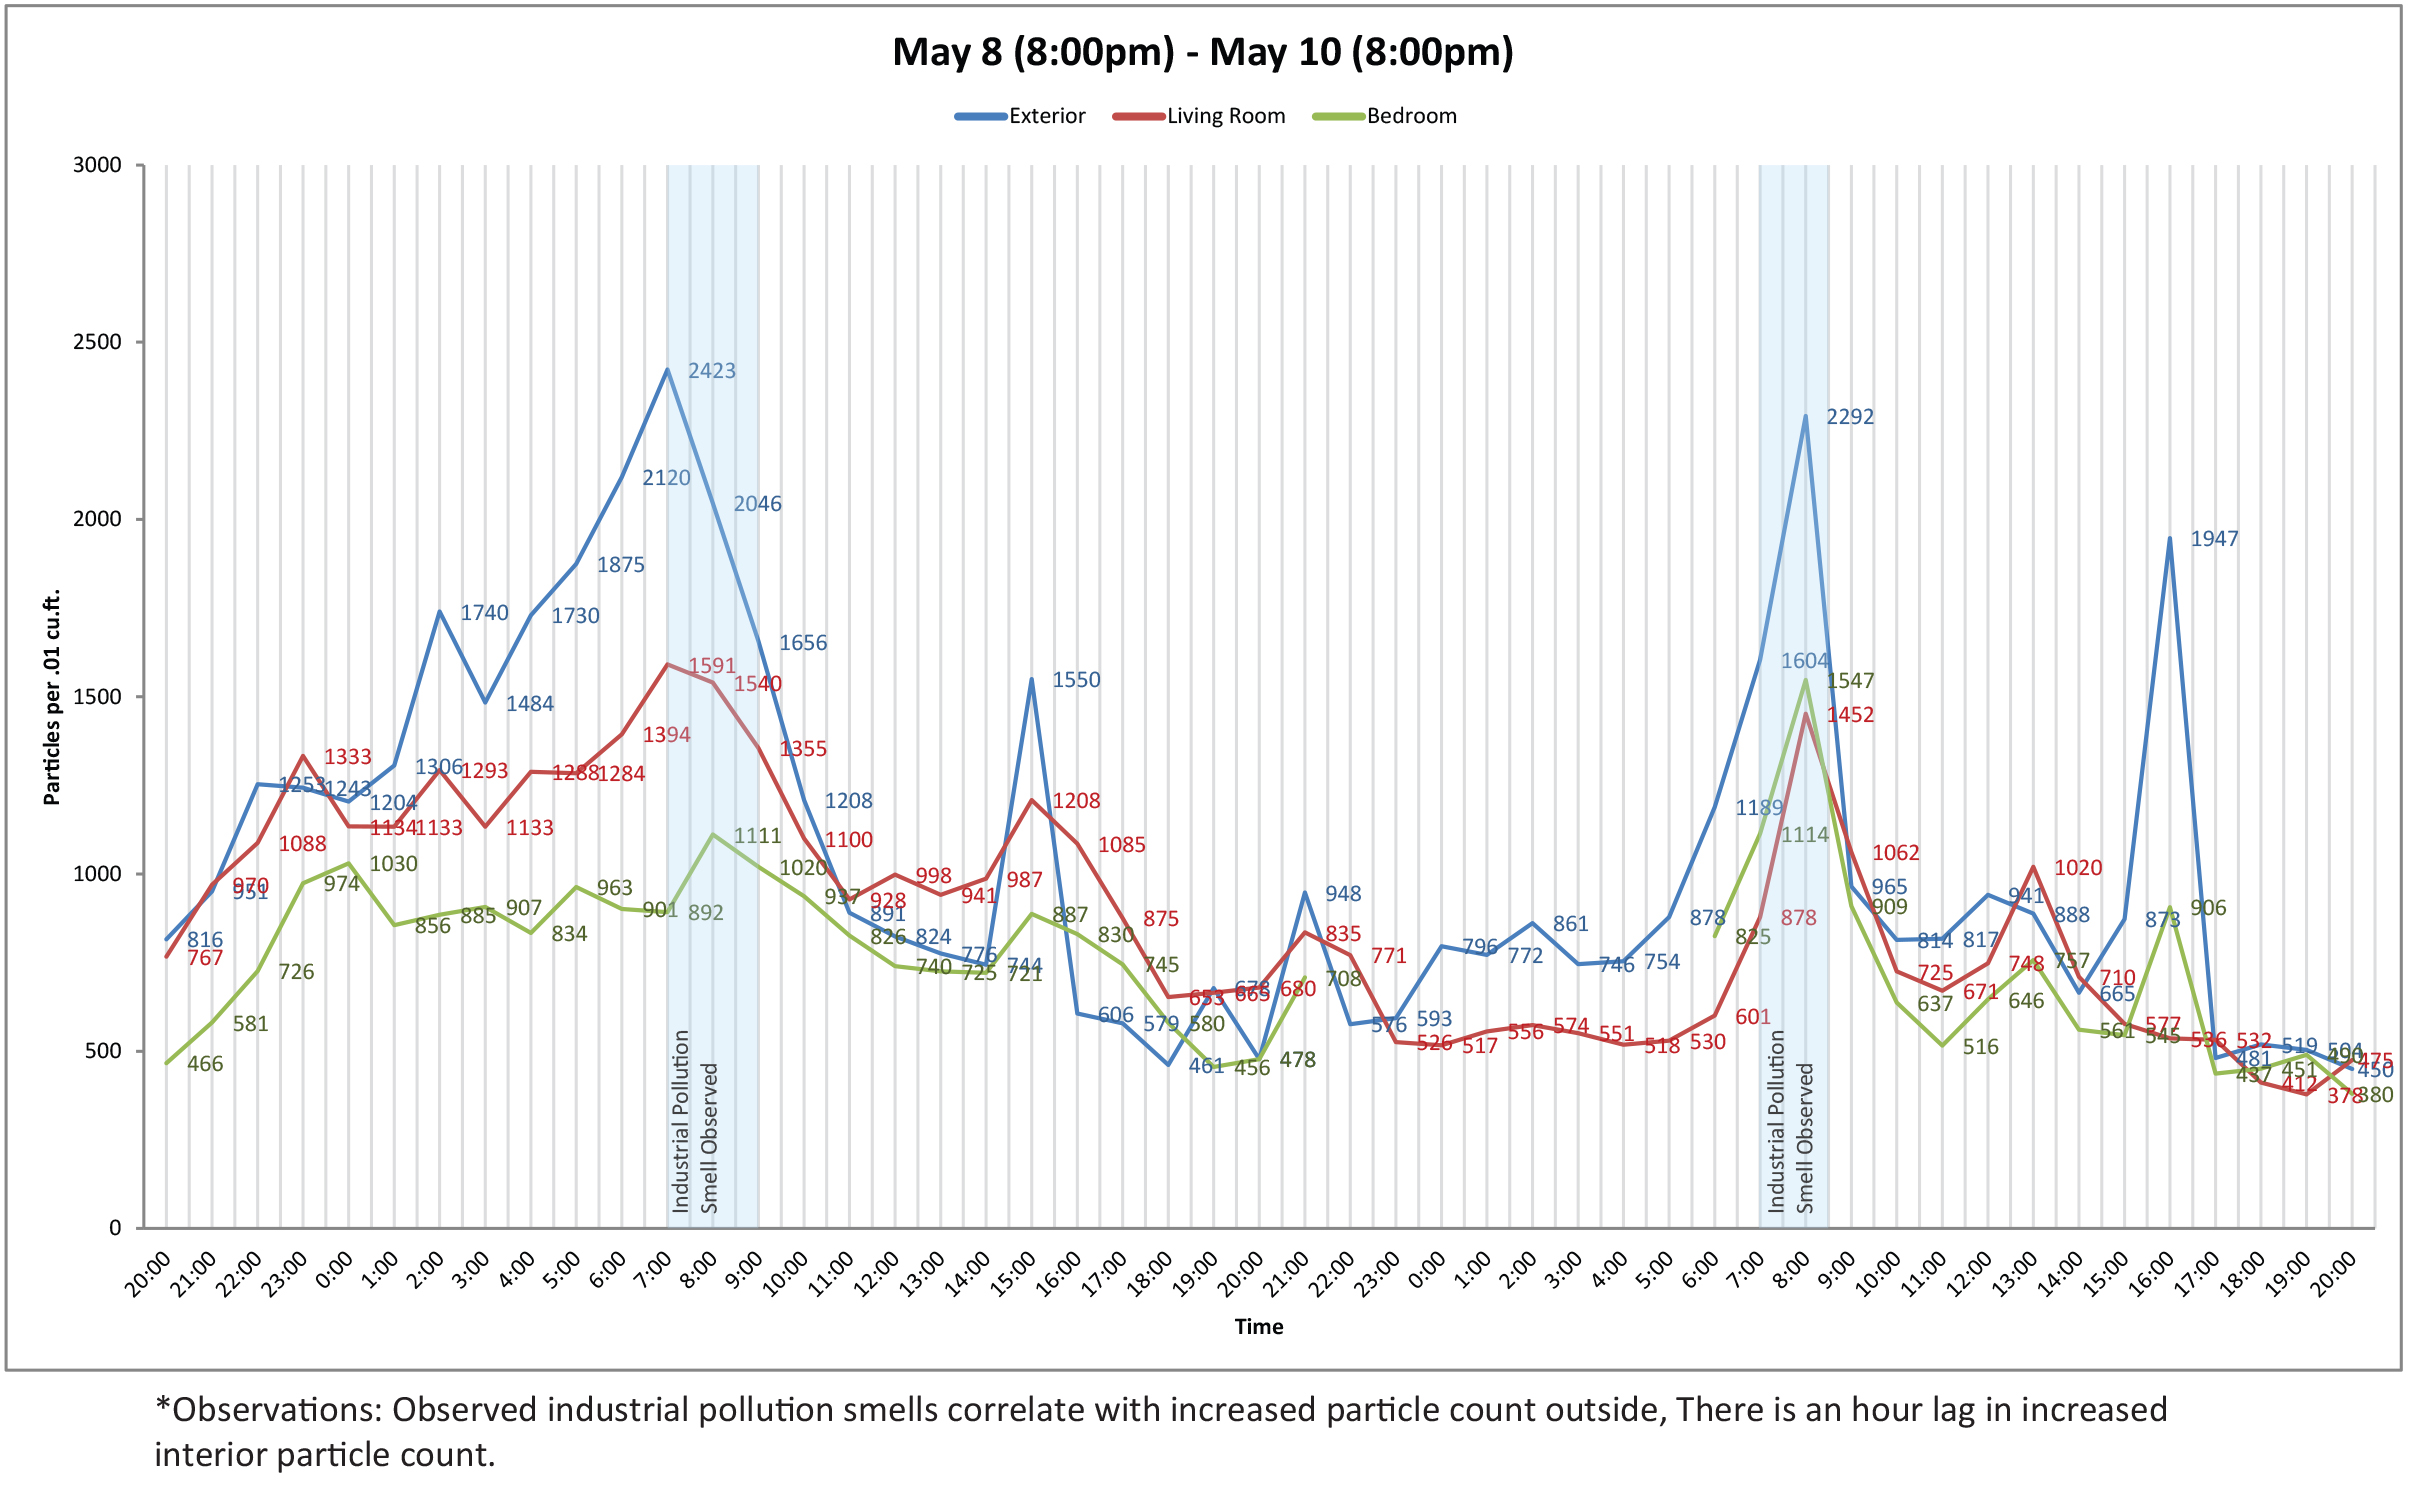
click to enlarge
This type of visualization has been made even easier by CMU CREATE Lab’s Speck. Speck is an air quality monitor that creates real-time visualizations of PM2.5 levels. It can also produce easy-to-read graphs of hourly data collected in your home, so you can track changes in the air quality over time. Speck monitors can be checked out of Carnegie Library for free, though the waiting list is long.
Bonus) In the Air: Visualizing What We Breathe. A photo exhibition that puts images to the often invisible problem of air pollution in the Pittsburgh region. Opens Friday, September 18, at Pittsburgh Filmmakers in North Oakland,
So, if you’re at the water cooler describing the heavy smell of pure industry that woke you up at 5am this morning, and a colleague replies, “I didn’t smell anything, but I know it’s better than it used to be,” use these three resources to show them what they can’t smell. And then tell them that, when it comes to air quality, there’s “better than it used to be,” and then there’s “clean.”