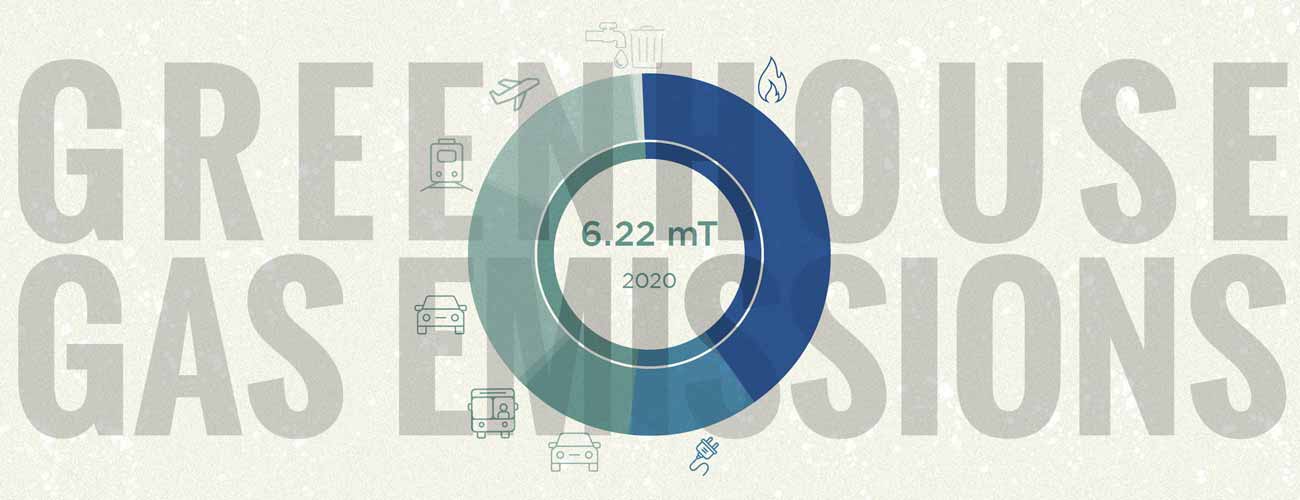
evolveEA’s 2020 Greenhouse Gas Audit
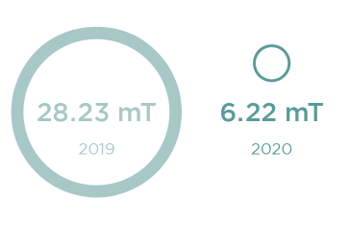
Like most offices, our HQ in Pittsburgh was closed for most of last year with our team working from home. Prior to 2020 evolveEA performed biannual Greenhouse Gas Audits to measure our emissions and then purchase carbon offsets to neutralize them. With big changes to how we work since the 2020 pandemic began, we wanted to see how our office emissions would compare to a “normal” year. So we performed a GHG Audit for last year, and not surprisingly, our total company footprint shrank 78% compared to emissions from 2019!
 We would like to share some details and observations from our audit, as well as our ongoing strategy for keeping evolveEA Carbon Neutral. Hopefully other businesses of all types and sizes are considering how to maintain growth and address the climate crisis by tracking and offsetting emissions, and this information could be useful. If your organization would like to become carbon neutral, start with the free TerraPass calculator: Terapass Carbon Footprint Calculator. After calculating our emissions we purchase carbon offsets from TerraPass. We are happy to help if you need advice or you are not sure how to track your carbon emissions—drop us a line. But first, see below to learn more.
What We Calculated
We looked at the Scope 1, Scope 2, and Scope 3 emissions in our office and compared the data to previous years. Scope 1 includes all direct emissions from the combustion of fuels on site. Scope 2 includes all indirect emissions from the purchase and transmission of electricity. And Scope 3 includes all other indirect emissions that are a result of our operations—transportation, water usage, and waste. Scope 3 was the largest savings for us, with an 87% reduction between 2019 and 2020.
An important note is that our methodology for carbon emissions did not include energy or heating costs for employees working from home. As remote work is incorporated into our long-term strategy of becoming a hybrid office, we will need to find ways to measure the increased energy demands from home office environments. A great resource we found that goes into detail about calculating home energy costs based on workforce composition and regional data is in this Homeworking emissions Whitepaper from EcoAct.
Our 2020 Impact Report Update includes more detailed information from the audit.
How We Calculated
For the first couple of months of 2020, our commuting data was similar to that of 2019. The waste and recycling ratio also remained the same for the beginning part of the year. Everything changed on March 13, 2020 when our office held our last in-person team meeting and began to work primarily from home. The office remained accessible, with COVID precautions and cleaning procedures in place for limited occupancy.
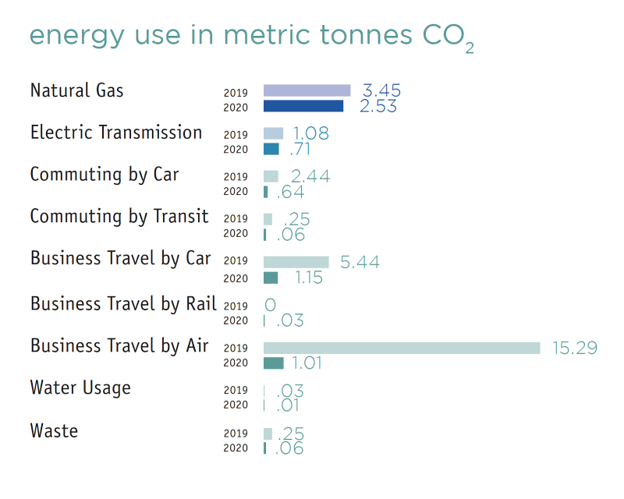
At the end of 2020, we polled our team to see what percentage of time they worked from home and used the information to calculate commute intensities. Our custodial cleaning decreased in frequency from once per week to once per month. Gas, electricity, and water usage were ascertained from ongoing monthly bills, but were noticeably lower. Our gas usage did not change much, with the only real savings being less heating in the Fall and Winter.
The team’s Business Travel by Air was the category with the most drastic reduction in emissions: 93%! Although some of us did feel like we would rather have had meetings and site visits in person, we have to acknowledge that air travel is the most carbon-intensive activity in our work. Our 2019 GHG audit showed the highest emissions for air travel in the company’s history because as we have grown, the geography of our projects has also expanded. Yet, 2020 taught us that we can still perform this work and put limits on travel.
Looks Can Be Deceiving
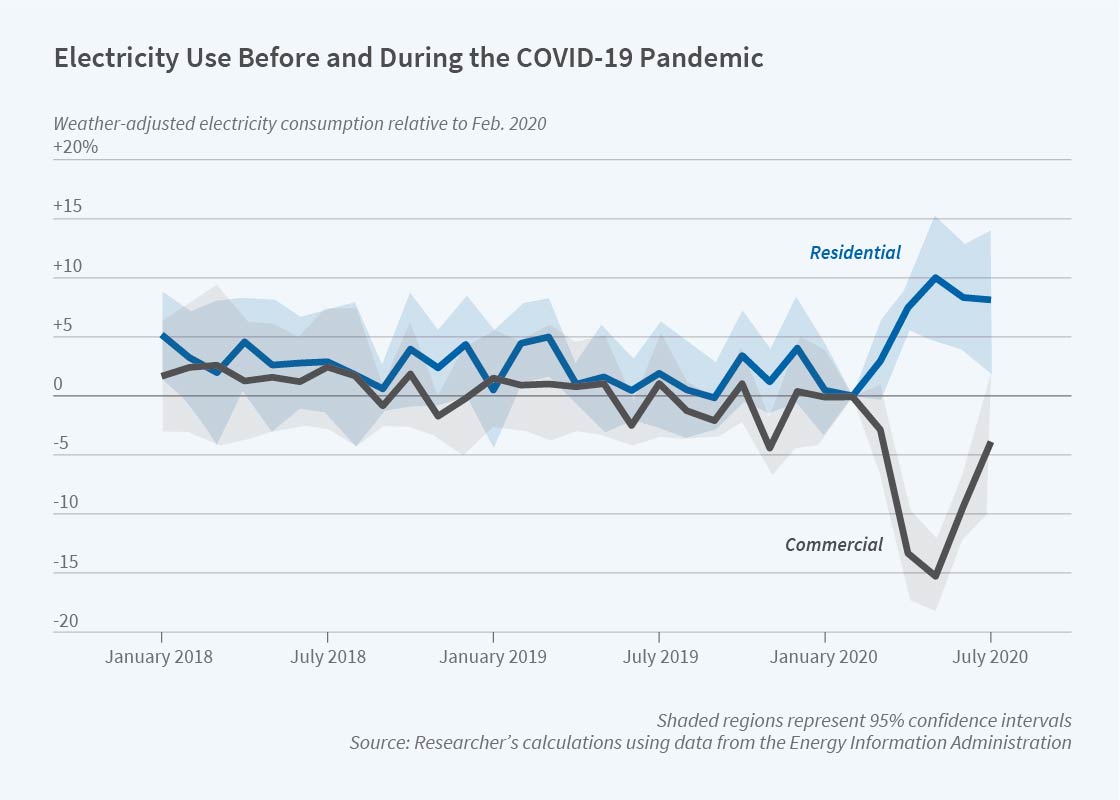
Although at first glance it appears that our office dramatically reduced its carbon emissions, this narrow comparison can be misleading. It is true that our office building’s energy use drastically decreased and business travel was sizably slimmed, however, home energy use increased across the board. This inverse is a testament to shifting energy demands, not their elimination.
According to the National Bureau of Economic Research, “Americans spent $6 billion more on at-home power consumption from April to July 2020 than during normal times, nearly offsetting a decline in business and industrial demand.”
How are evolvers Tracking Personal Emissions?
At evolve, we wanted to see how our team fared in the work-from-home era, what measures they had in place, and if anyone noticed an increase in home energy consumption in line with national data. The following are firsthand accounts from a few evolvers.
Nick has a Belkin Energy Use Monitor that displays how many watts of electricity a device uses when plugged into it. Attached to a smart power strip that distributes electricity only when needed, Nick was able to verify his home office equipment (1 monitor, 1 laptop, printer, occasional space heater, and phone charger) has an electrical rating of 115-122 watts. He then used that data to calculate his CO2e footprint to be 119 lbs CO2e (.059 mT) utilized April 2020 to April 2019 from his home office, which is about 10 lbs a month. In energy costs, he found it to be $1/month to power his office, or about $11.84 for the year.
He also noticed a change in how he and his partner heated their home.
“Our upstairs office gets extremely hot in the winter, therefore we turned the heat down from 70-71 [degrees Fahrenheit] to 65-68 this year. Our living space is usually downstairs and that gets very cold in the winter, but we didn’t use that space as much this year.”
Claudia noted another behavioral habit that was modified during the pandemic:
“I turn down the thermostat when I leave the house, but while working from home I never left the house!”
Although this had a small effect on her heating bill, she said there was not a large difference between winter and summer utilities compared to previous years thanks to the insulation work she had done on her house before the pandemic hit.
Many of us observed a change in habits compared to previous years, from solo inhabitants or those who reside with family members who similarly transitioned to working or learning from home in 2020. Our energy bills reflect this increase in heating/cooling hours, and the increased natural gas use can lead to increased emissions depending on occupancy patterns.
Elijah’s home is all-electric, including being heated by an electric heat pump. He has noticed similar patterns while working from home over the past year.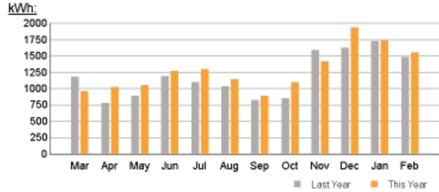
“Consistently, even in spring, fall, winter, summer, I have been using more electricity in the past year than the previous.”
Even if we use green power for our electricity, which many of us do, most of our homes are heated with natural gas. When we work from our primarily Mid-Atlantic and Northeastern homes especially over winter months, that adds to our per-capita emissions.
Although a sizable difference from 2019, we know these 2020 numbers are not the full story of our team’s true carbon footprint. The methods we used to calculate our emissions were not set up to account for people working from home. As we shift toward a hybrid office model, the specifics of which are still TBD, we need to reevaluate how our data might more closely reflect actual energy consumption.
Similar to the way we have been collecting data from our team about personal commutes and business travel to track emissions, we will either need to keep track of where each of us do our work or determine a per-person average that we can apply to company emissions moving forward.
A free tool from Watershed was recently shared to help businesses calculate the impact of shifting from a work-from-home to a hybrid office, and it is a reminder of all the factors that contribute to our personal and work carbon footprint:
watershedclimate.com/wfh-calculator
“Many people think the climate-conscious choice is to keep as much of the team working remotely for as long as possible,” reads an explanation on Watershed’s site. “The reality is more complicated. Remote work shifts carbon: Emissions from energy and food still exist, but at employees’ homes, where they may be better or worse than in the office.”
Future Factors
What we know at this point is that wherever we do our work in the future, we will be more intentional about how and where meetings take place. We will think more carefully about booking a flight, but it is likely that we will fly a few miles more next year than we did in 2020. And being together in a certain place may have benefits that justify the trip.
As Anna pointed out,
“It’s not just about our footprint, but our handprint, too.”
The kind of imprint we exchange, whether with communities or at conferences, has a net-positive human connection when our conversations and our work contribute to building resilient, sustainable, and empowered people, places, and processes.