Communicating with Infographics
evolveEA continuously evaluates how we help our clients tell their stories and analyze their data in clear and meaningful ways. We find that translating words and numbers into graphics enable a new level of understanding to any set of complex information and help make strategic thinking easier and more accessible. This is especially true in shaping the sustainability dialogue, with concepts that are often difficult to grasp without a visual reference to present data in tangible terms.
As a multidisciplinary environment, evolve is increasingly focused on the integration of design tools that can contribute to promoting and understanding sustainability. In order to highlight some key findings from our Event Venue Benchmarking Survey, we created this graphic storyboard on waste management. We find it effective to introduce topics and engage viewers by posing a question.
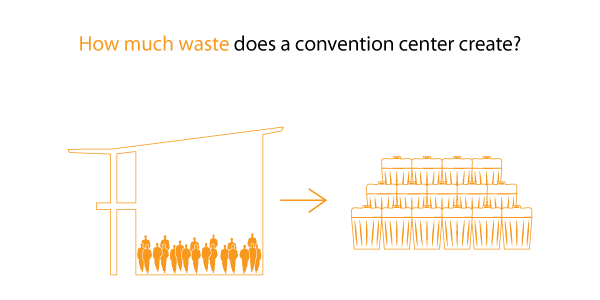
By visually telling the story of how seven different venues are dealing with their trash, we are able to bring forth important points about waste that are relevant for any individual or organization.
Like what you see? Get in touch to find out how we can help you visualize your data and explain ideas in new and insightful ways.